...
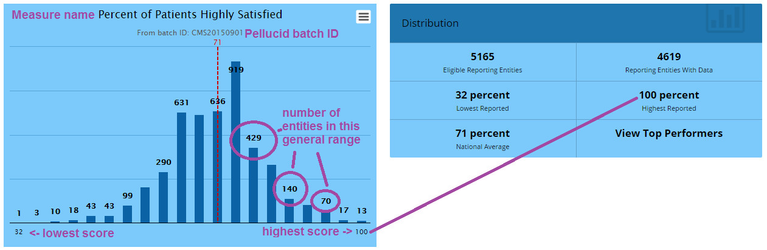
- Distribution: The range of scores, and the number of entities reporting this measure
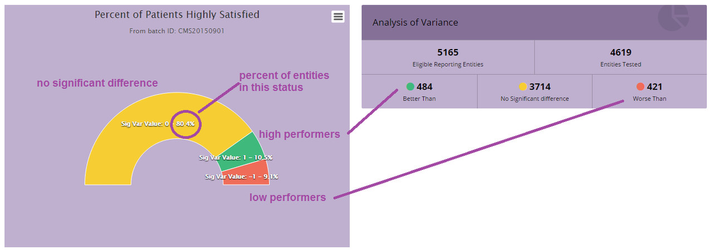
- Analysis of Variance: What proportion of reporting entities were found to achieve low or high performer status? (In Pellucid this is called "sigvar", -1 signals poor perform, +1 signals high performer)
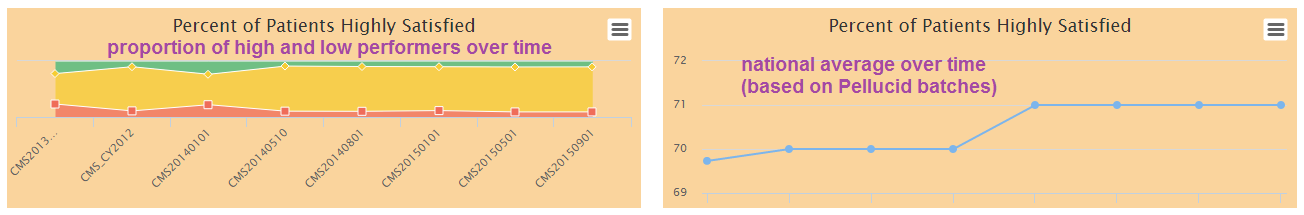
- Historical Data: How does the range of performer status move over time?